Prognostic value of combined MTV and ADC derived from baseline FDG PET/MRI in aggressive non-Hodgkins lymphoma
| dc.contributor.author | Husby, Trine | |
| dc.contributor.author | Johansen, Håkon | |
| dc.contributor.author | Bogsrud, Trond | |
| dc.contributor.author | Hustad, Kari Vekseth | |
| dc.contributor.author | Evensen, Birte Veslemøy | |
| dc.contributor.author | Boellaard, Ronald | |
| dc.contributor.author | Giskeødegård, Guro F. | |
| dc.contributor.author | Fagerli, Unn-Merete | |
| dc.contributor.author | Eikenes, Live | |
| dc.date.accessioned | 2023-01-26T15:42:22Z | |
| dc.date.available | 2023-01-26T15:42:22Z | |
| dc.date.created | 2022-11-19T14:17:03Z | |
| dc.date.issued | 2022 | |
| dc.identifier.citation | BMC Cancer. 2022, 22 (1), . | en_US |
| dc.identifier.issn | 1471-2407 | |
| dc.identifier.uri | https://hdl.handle.net/11250/3046683 | |
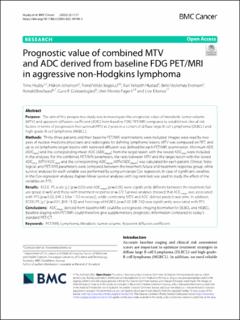
| dc.description.abstract | Purpose The aim of this prospective study was to investigate the prognostic value of metabolic tumor volume (MTV) and apparent diffusion coefficient (ADC) from baseline FDG PET/MRI compared to established clinical risk factors in terms of progression free survival (PFS) at 2 years in a cohort of diffuse large B-cell Lymphoma (DLBCL) and high-grade-B-cell lymphoma (HGBCL). Methods Thirty-three patients and their baseline PET/MRI examinations were included. Images were read by two pairs of nuclear medicine physicians and radiologists for defining lymphoma lesions. MTV was computed on PET, and up to six lymphoma target lesions with restricted diffusion was defined for each PET/MRI examination. Minimum ADC (ADCmin) and the corresponding mean ADC (ADCmean) from the target lesion with the lowest ADCmin were included in the analyses. For the combined PET/MRI parameters, the ratio between MTV and the target lesion with the lowest ADCmin (MTV/ADCmin) and the corresponding ADCmean (MTV/ADCmean) was calculated for each patient. Clinical, histological, and PET/MRI parameters were compared between the treatment failure and treatment response group, while survival analyses for each variable was performed by using univariate Cox regression. In case of significant variables in the Cox regression analyses, Kaplan-Meier survival analyses with log-rank test was used to study the effect of the variables on PFS. Results ECOC PS scale ≥2 (p = 0.05) and ADCmean (p = 0.05) were significantly different between the treatment failure group (n = 6) and those with treatment response (n = 27). Survival analyses showed that ADCmean was associated with PFS (p = 0.02, [HR 2.3 for 1 SD increase]), while combining MTV and ADC did not predict outcome. In addition, ECOG PS ≥2 (p = 0.01, [HR 13.3]) and histology of HGBCL (p = 0.02 [HR 7.6]) was significantly associated with PFS. Conclusions ADCmean derived from baseline MRI could be a prognostic imaging biomarker for DLBCL and HGBCL. Baseline staging with PET/MRI could therefore give supplementary prognostic information compared to today’s standard PET/CT. | en_US |
| dc.language.iso | eng | en_US |
| dc.publisher | BMC | en_US |
| dc.rights | Navngivelse 4.0 Internasjonal | * |
| dc.rights.uri | http://creativecommons.org/licenses/by/4.0/deed.no | * |
| dc.title | Prognostic value of combined MTV and ADC derived from baseline FDG PET/MRI in aggressive non-Hodgkins lymphoma | en_US |
| dc.title.alternative | Prognostic value of combined MTV and ADC derived from baseline FDG PET/MRI in aggressive non-Hodgkins lymphoma | en_US |
| dc.type | Peer reviewed | en_US |
| dc.type | Journal article | en_US |
| dc.description.version | publishedVersion | en_US |
| dc.source.pagenumber | 0 | en_US |
| dc.source.volume | 22 | en_US |
| dc.source.journal | BMC Cancer | en_US |
| dc.source.issue | 1 | en_US |
| dc.identifier.doi | 10.1186/s12885-022-10194-2 | |
| dc.identifier.cristin | 2076731 | |
| cristin.ispublished | true | |
| cristin.fulltext | original | |
| cristin.qualitycode | 1 |
Tilhørende fil(er)
Denne innførselen finnes i følgende samling(er)

Med mindre annet er angitt, så er denne innførselen lisensiert som Navngivelse 4.0 Internasjonal