3D Myocardial Mechanical Wave Measurements: Toward In Vivo 3D Myocardial Elasticity Mapping
| dc.contributor.author | Salles, Sebastien | |
| dc.contributor.author | Espeland, Torvald | |
| dc.contributor.author | Rodriguez-Molares, Alfonso | |
| dc.contributor.author | Aase, Svein Arne | |
| dc.contributor.author | Hammer, Tommy | |
| dc.contributor.author | Støylen, Asbjørn | |
| dc.contributor.author | Aakhus, Svend | |
| dc.contributor.author | Løvstakken, Lasse | |
| dc.contributor.author | Torp, Hans | |
| dc.date.accessioned | 2021-09-10T06:51:46Z | |
| dc.date.available | 2021-09-10T06:51:46Z | |
| dc.date.created | 2020-11-24T02:04:10Z | |
| dc.date.issued | 2020 | |
| dc.identifier.issn | 1936-878X | |
| dc.identifier.uri | https://hdl.handle.net/11250/2775091 | |
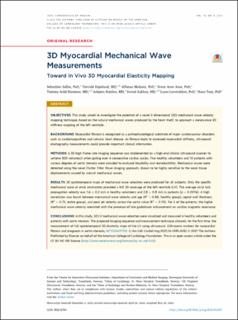
| dc.description.abstract | Objectives This study aimed to investigate the potential of a novel 3-dimensional (3D) mechanical wave velocity mapping technique, based on the natural mechanical waves produced by the heart itself, to approach a noninvasive 3D stiffness mapping of the left ventricle. Background Myocardial fibrosis is recognized as a pathophysiological substrate of major cardiovascular disorders such as cardiomyopathies and valvular heart disease. As fibrosis leads to increased myocardial stiffness, ultrasound elastography measurements could provide important clinical information. Methods A 3D high frame rate imaging sequence was implemented on a high-end clinical ultrasound scanner to achieve 820 volumes/s when gating over 4 consecutive cardiac cycles. Five healthy volunteers and 10 patients with various degrees of aortic stenosis were included to evaluate feasibility and reproducibility. Mechanical waves were detected using the novel Clutter Filter Wave Imaging approach, shown to be highly sensitive to the weak tissue displacements caused by natural mechanical waves. Results 3D spatiotemporal maps of mechanical wave velocities were produced for all subjects. Only the specific mechanical wave at atrial contraction provided a full 3D coverage of the left ventricle (LV). The average atrial kick propagation velocity was 1.6 ± 0.2 m/s in healthy volunteers and 2.8 ± 0.8 m/s in patients (p = 0.0016). A high correlation was found between mechanical wave velocity and age (R2 = 0.88, healthy group), septal wall thickness (R2 = 0.73, entire group), and peak jet velocity across the aortic valve (R2 = 0.70). For 3 of the patients, the higher mechanical wave velocity coexisted with the presence of late gadolinium enhancement on cardiac magnetic resonance. Conclusions In this study, 3D LV mechanical wave velocities were visualized and measured in healthy volunteers and patients with aortic stenosis. The proposed imaging sequence and measurement technique allowed, for the first time, the measurement of full spatiotemporal 3D elasticity maps of the LV using ultrasound. (Ultrasonic markers for myocardial fibrosis and prognosis in aortic stenosis; NCT03422770) | en_US |
| dc.language.iso | eng | en_US |
| dc.publisher | Elsevier | en_US |
| dc.rights | Attribution-NonCommercial-NoDerivatives 4.0 Internasjonal | * |
| dc.rights.uri | http://creativecommons.org/licenses/by-nc-nd/4.0/deed.no | * |
| dc.title | 3D Myocardial Mechanical Wave Measurements: Toward In Vivo 3D Myocardial Elasticity Mapping | en_US |
| dc.type | Peer reviewed | en_US |
| dc.type | Journal article | en_US |
| dc.description.version | publishedVersion | en_US |
| dc.source.journal | JACC Cardiovascular Imaging | en_US |
| dc.identifier.doi | 10.1016/j.jcmg.2020.05.037 | |
| dc.identifier.cristin | 1851311 | |
| dc.relation.project | Norges forskningsråd: 237887 | en_US |
| cristin.ispublished | true | |
| cristin.fulltext | original | |
| cristin.qualitycode | 2 |
Tilhørende fil(er)
Denne innførselen finnes i følgende samling(er)

Med mindre annet er angitt, så er denne innførselen lisensiert som Attribution-NonCommercial-NoDerivatives 4.0 Internasjonal