The U-Net Family for Epicardial Adipose Tissue Segmentation and Quantification in Low-Dose CT
| dc.contributor.author | Liu, Lu | |
| dc.contributor.author | Ma, Runlei | |
| dc.contributor.author | van Ooijen, Peter M. A. | |
| dc.contributor.author | Oudkerk, Matthijs | |
| dc.contributor.author | Vliegenthart, Rozemarijn | |
| dc.contributor.author | Veldhuis, Raymond Nicolaas Johan | |
| dc.contributor.author | Brune, Christoph | |
| dc.date.accessioned | 2024-01-19T11:37:17Z | |
| dc.date.available | 2024-01-19T11:37:17Z | |
| dc.date.created | 2023-09-11T12:55:57Z | |
| dc.date.issued | 2023 | |
| dc.identifier.citation | Technologies. 2023, 11 (4), . | en_US |
| dc.identifier.issn | 2227-7080 | |
| dc.identifier.uri | https://hdl.handle.net/11250/3112787 | |
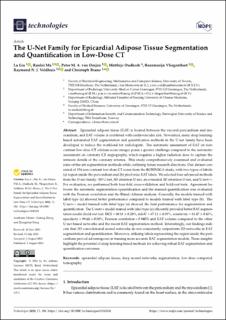
| dc.description.abstract | Epicardial adipose tissue (EAT) is located between the visceral pericardium and myocardium, and EAT volume is correlated with cardiovascular risk. Nowadays, many deep learning-based automated EAT segmentation and quantification methods in the U-net family have been developed to reduce the workload for radiologists. The automatic assessment of EAT on non-contrast low-dose CT calcium score images poses a greater challenge compared to the automatic assessment on coronary CT angiography, which requires a higher radiation dose to capture the intricate details of the coronary arteries. This study comprehensively examined and evaluated state-of-the-art segmentation methods while outlining future research directions. Our dataset consisted of 154 non-contrast low-dose CT scans from the ROBINSCA study, with two types of labels: (a) region inside the pericardium and (b) pixel-wise EAT labels. We selected four advanced methods from the U-net family: 3D U-net, 3D attention U-net, an extended 3D attention U-net, and U-net++. For evaluation, we performed both four-fold cross-validation and hold-out tests. Agreement between the automatic segmentation/quantification and the manual quantification was evaluated with the Pearson correlation and the Bland–Altman analysis. Generally, the models trained with label type (a) showed better performance compared to models trained with label type (b). The U-net++ model trained with label type (a) showed the best performance for segmentation and quantification. The U-net++ model trained with label type (a) efficiently provided better EAT segmentation results (hold-out test: DCS = 80.18±0.20%, mIoU = 67.13±0.39%, sensitivity = 81.47±0.43%, specificity = 99.64±0.00%, Pearson correlation = 0.9405) and EAT volume compared to the other U-net-based networks and the recent EAT segmentation method. Interestingly, our findings indicate that 3D convolutional neural networks do not consistently outperform 2D networks in EAT segmentation and quantification. Moreover, utilizing labels representing the region inside the pericardium proved advantageous in training more accurate EAT segmentation models. These insights highlight the potential of deep learning-based methods for achieving robust EAT segmentation and quantification outcomes. | en_US |
| dc.language.iso | eng | en_US |
| dc.publisher | MDPI | en_US |
| dc.rights | Navngivelse 4.0 Internasjonal | * |
| dc.rights.uri | http://creativecommons.org/licenses/by/4.0/deed.no | * |
| dc.title | The U-Net Family for Epicardial Adipose Tissue Segmentation and Quantification in Low-Dose CT | en_US |
| dc.title.alternative | The U-Net Family for Epicardial Adipose Tissue Segmentation and Quantification in Low-Dose CT | en_US |
| dc.type | Peer reviewed | en_US |
| dc.type | Journal article | en_US |
| dc.description.version | publishedVersion | en_US |
| dc.source.volume | 11 | en_US |
| dc.source.journal | Technologies | en_US |
| dc.source.issue | 4 | en_US |
| dc.identifier.doi | 10.3390/technologies11040104 | |
| dc.identifier.cristin | 2173970 | |
| cristin.ispublished | true | |
| cristin.fulltext | original | |
| cristin.qualitycode | 1 |
Tilhørende fil(er)
Denne innførselen finnes i følgende samling(er)

Med mindre annet er angitt, så er denne innførselen lisensiert som Navngivelse 4.0 Internasjonal