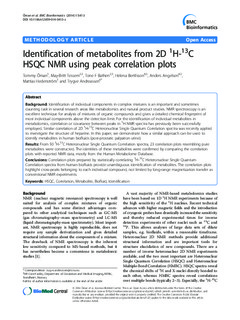
Identification of Metabolites from 2D 1H-13C HSQC NMR using Peak Correlation Plots
| dc.contributor.author | Öman, Tommy | |
| dc.contributor.author | Tessem, May-Britt | |
| dc.contributor.author | Bathen, Tone Frost | |
| dc.contributor.author | Bertilsson, Helena | |
| dc.contributor.author | Angelsen, Anders | |
| dc.contributor.author | Hedenström, Mattias | |
| dc.contributor.author | Andreassen, Trygve | |
| dc.date.accessioned | 2015-09-21T12:00:36Z | |
| dc.date.accessioned | 2016-06-16T07:37:23Z | |
| dc.date.available | 2015-09-21T12:00:36Z | |
| dc.date.available | 2016-06-16T07:37:23Z | |
| dc.date.issued | 2014 | |
| dc.identifier.citation | BMC Bioinformatics 2014, 15(1) | nb_NO |
| dc.identifier.issn | 1471-2105 | |
| dc.identifier.uri | http://hdl.handle.net/11250/2392771 | |
| dc.description.abstract | Background Identification of individual components in complex mixtures is an important and sometimes daunting task in several research areas like metabolomics and natural product studies. NMR spectroscopy is an excellent technique for analysis of mixtures of organic compounds and gives a detailed chemical fingerprint of most individual components above the detection limit. For the identification of individual metabolites in metabolomics, correlation or covariance between peaks in 1H NMR spectra has previously been successfully employed. Similar correlation of 2D 1H-13C Heteronuclear Single Quantum Correlation spectra was recently applied to investigate the structure of heparine. In this paper, we demonstrate how a similar approach can be used to identify metabolites in human biofluids (post-prostatic palpation urine). Results From 50 1H-13C Heteronuclear Single Quantum Correlation spectra, 23 correlation plots resembling pure metabolites were constructed. The identities of these metabolites were confirmed by comparing the correlation plots with reported NMR data, mostly from the Human Metabolome Database. Conclusions Correlation plots prepared by statistically correlating 1H-13C Heteronuclear Single Quantum Correlation spectra from human biofluids provide unambiguous identification of metabolites. The correlation plots highlight cross-peaks belonging to each individual compound, not limited by long-range magnetization transfer as conventional NMR experiments. | nb_NO |
| dc.language.iso | eng | nb_NO |
| dc.publisher | BioMed Central | nb_NO |
| dc.rights | Navngivelse 3.0 Norge | * |
| dc.rights.uri | http://creativecommons.org/licenses/by/3.0/no/ | * |
| dc.title | Identification of Metabolites from 2D 1H-13C HSQC NMR using Peak Correlation Plots | nb_NO |
| dc.type | Journal article | nb_NO |
| dc.type | Peer reviewed | nb_NO |
| dc.date.updated | 2015-09-21T12:00:36Z | |
| dc.source.volume | 15 | nb_NO |
| dc.source.journal | BMC Bioinformatics | nb_NO |
| dc.source.issue | 1 | nb_NO |
| dc.identifier.doi | 10.1186/s12859-014-0413-z | |
| dc.identifier.cristin | 1196286 | |
| dc.description.localcode | © 2014 Öman et al.; licensee BioMed Central. This is an Open Access article distributed under the terms of the Creative Commons Attribution License (http://creativecommons.org/licenses/by/4.0), which permits unrestricted use, distribution, and reproduction in any medium, provided the original work is properly credited. The Creative Commons Public Domain Dedication waiver (http://creativecommons.org/publicdomain/zero/1.0/) applies to the data made available in this article,unless otherwise stated. | nb_NO |
Tilhørende fil(er)
Denne innførselen finnes i følgende samling(er)

Med mindre annet er angitt, så er denne innførselen lisensiert som Navngivelse 3.0 Norge