| dc.contributor.author | Nordvik, Trond | |
| dc.contributor.author | Nyrnes, Erik | |
| dc.date.accessioned | 2015-09-29T11:53:16Z | |
| dc.date.accessioned | 2015-10-23T08:33:35Z | |
| dc.date.available | 2015-09-29T11:53:16Z | |
| dc.date.available | 2015-10-23T08:33:35Z | |
| dc.date.issued | 2009 | |
| dc.identifier.citation | Natural hazards and earth system sciences 2009, 9(3):713-724 | nb_NO |
| dc.identifier.issn | 1684-9981 | |
| dc.identifier.uri | http://hdl.handle.net/11250/2357824 | |
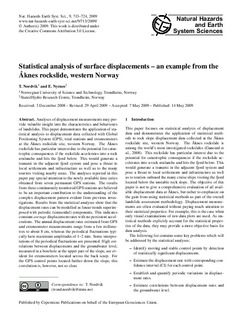
| dc.description.abstract | Analyses of displacement measurements may provide
valuable insight into the characteristics and behaviours
of landslides. This paper demonstrates the application of statistical
analysis to displacement data collected with Global
Positioning System (GPS), total stations and extensometers
at the A° knes rockslide site, western Norway. The A° knes
rockslide has particular interest due to the potential for catastrophic
consequences if the rockslide accelerates into a rock
avalanche and hits the fjord below. This would generate a
tsunami in the adjacent fjord system and pose a threat to
local settlements and infrastructure as well as to the many
tourists visiting nearby areas. The analyses reported in this
paper pay special attention to the newly available time series
obtained from seven permanent GPS stations. The results
from these continuously monitored GPS stations are believed
to be an important contribution to the understanding of the
complex displacement pattern evident from previous investigations.
Results from the statistical analyses show that the
displacement rates can be modelled as linear trends superimposed
with periodic (sinusoidal) components. This indicates
constant average displacement rates with no persistent accelerations.
The annual displacement rates estimated from GPS
and extensometer measurements range from a few millimetres
to about 8 cm, whereas the periodical fluctuations typically
have maximum amplitudes of 1–2 mm. Some interpretations
of the periodical fluctuations are presented. High correlations
between displacements and the groundwater level,
measured in a borehole at the upper part of the slope, are evident
for extensometers located across the back scarp. For
the GPS control points located further down the slope, this
correlation is, however, not so clear. | nb_NO |
| dc.language.iso | eng | nb_NO |
| dc.publisher | European Geosciences Union | nb_NO |
| dc.relation.uri | http://www.nat-hazards-earth-syst-sci.net/9/713/2009/nhess-9-713-2009.pdf | |
| dc.title | Statistical analysis of surface displacements – an example from the Åknes rockslide, western Norway | nb_NO |
| dc.type | Journal article | nb_NO |
| dc.type | Peer reviewed | en_GB |
| dc.date.updated | 2015-09-29T11:53:15Z | |
| dc.source.volume | 9 | nb_NO |
| dc.source.journal | Natural Hazards and Earth System Sciences | nb_NO |
| dc.source.issue | 3 | nb_NO |
| dc.identifier.doi | 10.5194/nhess-9-713-2009 | |
| dc.identifier.cristin | 344984 | |
| dc.description.localcode | © Author(s) 2009. This work is distributed under the Creative Commons Attribution 3.0 License. | nb_NO |