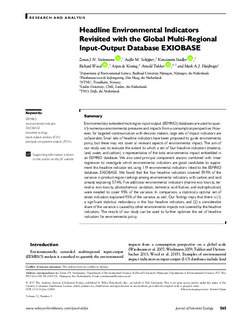
Headline Environmental Indicators Revisited with the Global Multi-Regional Input-Output Database EXIOBASE
| dc.contributor.author | Steinmann, Zoran J.N. | |
| dc.contributor.author | Schipper, Aafke M. | |
| dc.contributor.author | Stadler, Konstantin | |
| dc.contributor.author | Wood, Richard | |
| dc.contributor.author | Koning, A. J. | |
| dc.contributor.author | Tukker, Arnold | |
| dc.contributor.author | Huijbregts, Mark A. J, | |
| dc.date.accessioned | 2019-02-28T09:57:39Z | |
| dc.date.available | 2019-02-28T09:57:39Z | |
| dc.date.created | 2018-01-03T13:49:18Z | |
| dc.date.issued | 2018 | |
| dc.identifier.citation | Journal of Industrial Ecology. 2018, 22 (3), 565-573. | nb_NO |
| dc.identifier.issn | 1088-1980 | |
| dc.identifier.uri | http://hdl.handle.net/11250/2587976 | |
| dc.description.abstract | Environmentally extended multiregion input‐output (EEMRIO) databases are used to quantify numerous environmental pressures and impacts from a consumption perspective. However, for targeted communication with decision makers, large sets of impact indicators are unfavorable. Small sets of headline indicators have been proposed to guide environmental policy, but these may not cover all relevant aspects of environmental impact. The aim of our study was to evaluate the extent to which a set of four headline indicators (material, land, water, and carbon) is representative of the total environmental impact embedded in an EEMRIO database. We also used principal component analysis combined with linear regression to investigate which environmental indicators are good candidates to supplement this headline indicator set, using 119 environmental indicators linked to the EEMRIO database, EXIOBASE. We found that the four headline indicators covered 59.9% of the variance in product‐region rankings among environmental indicators, with carbon and land already explaining 57.4%. Five additional environmental indicators (marine eco‐toxicity, terrestrial eco‐toxicity, photochemical oxidation, terrestrial acidification, and eutrophication) were needed to cover 95% of the variance. In comparison, a statistically optimal set of seven indicators explained 95% of the variance as well. Our findings imply that there is (1) a significant statistical redundancy in the four headline indicators, and (2) a considerable share of the variance is caused by other environmental impacts not covered by the headline indicators. The results of our study can be used to further optimize the set of headline indicators for environmental policy. | nb_NO |
| dc.language.iso | eng | nb_NO |
| dc.publisher | Wiley | nb_NO |
| dc.rights | Navngivelse 4.0 Internasjonal | * |
| dc.rights.uri | http://creativecommons.org/licenses/by/4.0/deed.no | * |
| dc.title | Headline Environmental Indicators Revisited with the Global Multi-Regional Input-Output Database EXIOBASE | nb_NO |
| dc.type | Journal article | nb_NO |
| dc.type | Peer reviewed | nb_NO |
| dc.description.version | publishedVersion | nb_NO |
| dc.source.pagenumber | 565-573 | nb_NO |
| dc.source.volume | 22 | nb_NO |
| dc.source.journal | Journal of Industrial Ecology | nb_NO |
| dc.source.issue | 3 | nb_NO |
| dc.identifier.doi | 10.1111/jiec.12694 | |
| dc.identifier.cristin | 1534903 | |
| dc.description.localcode | © 2017 The Authors. Journal of Industrial Ecology, published by Wiley Periodicals, Inc., on behalf of Yale University This is an open access article under the terms of the Creative Commons Attribution License, which permits use, distribution and reproduction in any medium, provided the original work is properly cited. | nb_NO |
| cristin.unitcode | 194,64,25,0 | |
| cristin.unitname | Institutt for energi- og prosessteknikk | |
| cristin.ispublished | true | |
| cristin.fulltext | original | |
| cristin.qualitycode | 2 |
Files in this item
This item appears in the following Collection(s)

Except where otherwise noted, this item's license is described as Navngivelse 4.0 Internasjonal