GXP: Analyze and Plot Plant Omics Data in Web Browsers
| dc.contributor.author | Eiteneuer, Constantin | |
| dc.contributor.author | Velasco, David | |
| dc.contributor.author | Atemia, Joseph | |
| dc.contributor.author | Wang, Dan | |
| dc.contributor.author | Schwacke, Rainer | |
| dc.contributor.author | Wahl, Vanessa | |
| dc.contributor.author | Schrader, Andrea | |
| dc.contributor.author | Reimer, Julia J. | |
| dc.contributor.author | Fahrner, Sven | |
| dc.contributor.author | Pieruschka, Roland | |
| dc.contributor.author | Schurr, Ulrich | |
| dc.contributor.author | Usadel, Björn | |
| dc.contributor.author | Hallab, Asis | |
| dc.date.accessioned | 2023-02-22T12:28:24Z | |
| dc.date.available | 2023-02-22T12:28:24Z | |
| dc.date.created | 2022-04-03T13:11:16Z | |
| dc.date.issued | 2022 | |
| dc.identifier.citation | Plants. 2022, 11 (6), . | en_US |
| dc.identifier.issn | 2223-7747 | |
| dc.identifier.uri | https://hdl.handle.net/11250/3053281 | |
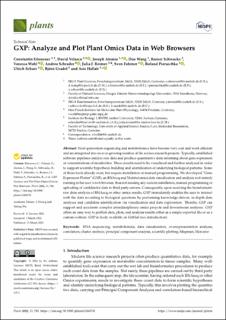
| dc.description.abstract | Next-generation sequencing and metabolomics have become very cost and work efficient and are integrated into an ever-growing number of life science research projects. Typically, established software pipelines analyze raw data and produce quantitative data informing about gene expression or concentrations of metabolites. These results need to be visualized and further analyzed in order to support scientific hypothesis building and identification of underlying biological patterns. Some of these tools already exist, but require installation or manual programming. We developed “Gene Expression Plotter” (GXP), an RNAseq and Metabolomics data visualization and analysis tool entirely running in the user’s web browser, thus not needing any custom installation, manual programming or uploading of confidential data to third party servers. Consequently, upon receiving the bioinformatic raw data analysis of RNAseq or other omics results, GXP immediately enables the user to interact with the data according to biological questions by performing knowledge-driven, in-depth data analyses and candidate identification via visualization and data exploration. Thereby, GXP can support and accelerate complex interdisciplinary omics projects and downstream analyses. GXP offers an easy way to publish data, plots, and analysis results either as a simple exported file or as a custom website. GXP is freely available on GitHub (see introduction) | en_US |
| dc.language.iso | eng | en_US |
| dc.publisher | MDPI | en_US |
| dc.rights | Navngivelse 4.0 Internasjonal | * |
| dc.rights.uri | http://creativecommons.org/licenses/by/4.0/deed.no | * |
| dc.title | GXP: Analyze and Plot Plant Omics Data in Web Browsers | en_US |
| dc.title.alternative | GXP: Analyze and Plot Plant Omics Data in Web Browsers | en_US |
| dc.type | Peer reviewed | en_US |
| dc.type | Journal article | en_US |
| dc.description.version | publishedVersion | en_US |
| dc.source.volume | 11 | en_US |
| dc.source.journal | Plants | en_US |
| dc.source.issue | 6 | en_US |
| dc.identifier.doi | 10.3390/plants11060745 | |
| dc.identifier.cristin | 2014855 | |
| cristin.ispublished | true | |
| cristin.fulltext | original | |
| cristin.qualitycode | 1 |
Files in this item
This item appears in the following Collection(s)

Except where otherwise noted, this item's license is described as Navngivelse 4.0 Internasjonal