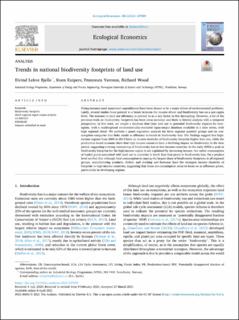
Trends in national biodiversity footprints of land use
| dc.contributor.author | Bjelle, Eivind Lekve | |
| dc.contributor.author | Kuipers, Koen Jacobus Josefus | |
| dc.contributor.author | Verones, Francesca | |
| dc.contributor.author | Wood, Richard | |
| dc.date.accessioned | 2021-11-03T09:25:39Z | |
| dc.date.available | 2021-11-03T09:25:39Z | |
| dc.date.created | 2021-04-16T10:13:04Z | |
| dc.date.issued | 2021 | |
| dc.identifier.citation | Ecological Economics. 2021, 185 1-11. | en_US |
| dc.identifier.issn | 0921-8009 | |
| dc.identifier.uri | https://hdl.handle.net/11250/2827513 | |
| dc.description.abstract | Rising incomes (and associated expenditures) have been shown to be a major driver of environmental problems. Lately, several studies have pointed to a break between the income driver and biodiversity loss on a per-capita level. The increase in land-use efficiency is pointed to as a key factor in this decoupling. However, a lot of the previous work on biodiversity footprints has been cross-sectional and there is limited analysis with a temporal perspective. In this work, we couple a database that links land use to potential biodiversity impacts for ecoregions, with a multiregional environmentally-extended input-output database available in a time series, with high regional detail. We perform a panel regression analysis for three regional quantile groups and six consumption categories that links trends in affluence to trends in biodiversity loss. The findings suggest that high-income regions from 2005 to 2015 have an income elasticity of biodiversity footprint higher than one, while the production-based accounts show that high-income countries have a declining impact on biodiversity in the time period, suggesting a strong outsourcing of biodiversity loss to low-income countries. In the early 2000s a peak in biodiversity footprint for the high-income region is not explained by increasing income, but rather consumption of traded goods associated with land use in countries in South East Asia prone to biodiversity loss. On a product level we find that although food consumption is causing the largest share of biodiversity footprints in all regional groups, manufacturing products, shelter, and clothing and footwear have the strongest income elasticity of footprint in high-income countries, suggesting that these are consumption areas to focus on as affluence grows, particularly in developing regions. | en_US |
| dc.language.iso | eng | en_US |
| dc.publisher | Elsevier | en_US |
| dc.relation.uri | https://www.sciencedirect.com/science/article/pii/S0921800921001178 | |
| dc.rights | Navngivelse 4.0 Internasjonal | * |
| dc.rights.uri | http://creativecommons.org/licenses/by/4.0/deed.no | * |
| dc.title | Trends in national biodiversity footprints of land use | en_US |
| dc.type | Peer reviewed | en_US |
| dc.type | Journal article | en_US |
| dc.description.version | publishedVersion | en_US |
| dc.source.pagenumber | 1-11 | en_US |
| dc.source.volume | 185 | en_US |
| dc.source.journal | Ecological Economics | en_US |
| dc.identifier.doi | 10.1016/j.ecolecon.2021.107059 | |
| dc.identifier.cristin | 1904509 | |
| cristin.ispublished | true | |
| cristin.fulltext | postprint | |
| cristin.qualitycode | 1 |
Tilhørende fil(er)
Denne innførselen finnes i følgende samling(er)

Med mindre annet er angitt, så er denne innførselen lisensiert som Navngivelse 4.0 Internasjonal